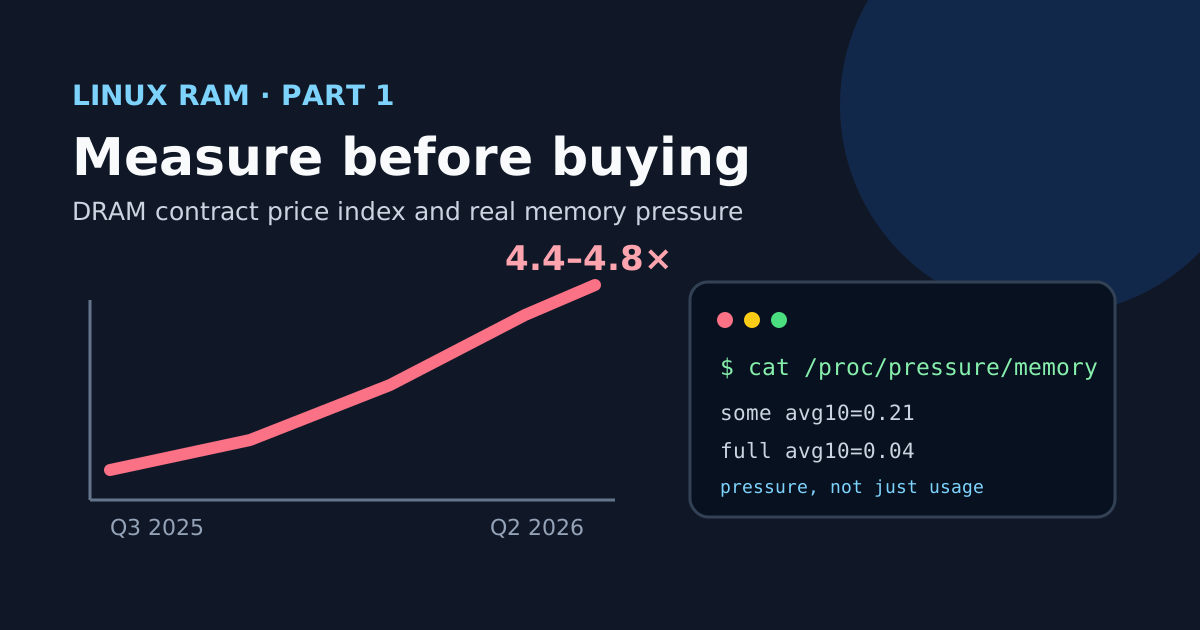
The first time I priced out a memory upgrade this year, I assumed the listing was wrong. It wasn’t. DRAM contract prices are now more than four times what they were in the third quarter of 2025, and suddenly a question that used to be a no-brainer — “should I just add RAM?” — is worth actual engineering time again.
That’s what this series is about. For years, throwing memory at the problem was the rational move: RAM was cheap, engineer hours weren’t. In 2026 that math has flipped, and before spending money at these prices you want to know whether the constraint is real memory pressure, reclaimable cache that only looks like consumption, or one process that nobody has looked at in months. This first part builds that answer — a reliable baseline. Part 2 configures swap, zram and zswap , part 3 contains services with cgroups , and part 4 puts it all together into a plan and a buy-or-optimize decision .
More than four times — but which price?
“RAM costs four times more” is the kind of claim that deserves a source, because it can mix very different things: spot chip prices, OEM contracts, retail DIMMs, DDR4 versus DDR5 versus HBM. To keep the comparison honest, this series uses one consistent metric — TrendForce’s contract prices for conventional DRAM:
| Period | Quarter-over-quarter change | Data status |
|---|---|---|
| Q4 2025 | +45–50% | measured |
| Q1 2026 | +93–98% | measured |
| Q2 2026 | +58–63% | forecast published June 1, 2026 |
Quarterly changes compound, they don’t add. The low end works out to 1.45 × 1.93 × 1.58 = 4.42, the high end to 1.50 × 1.98 × 1.63 = 4.84. So the implied contract price at the end of Q2 sits at 4.4–4.8 times the Q3 2025 level.
That doesn’t mean every retail kit in every shop went up exactly 4.4×. Inventory, tax, currency, brand and discounts all bend the pass-through. But it does document that the underlying industrial cost changed by an order of magnitude, and that’s what matters for the decision this series is about.
The cause isn’t one broken factory, either. TrendForce ties the surge to cloud and AI data-center demand, exceptionally low supplier inventory, and manufacturers prioritizing high-capacity RDIMMs, server DRAM and HBM — which leaves PCs and everything legacy competing for a tighter slice of supply.
First rule: free memory is not wasted memory
The natural starting point:
free -h
And the natural mistake: trying to make the free column bigger. Linux deliberately uses otherwise idle RAM as page cache — that memory is doing useful work and gets reclaimed the moment something else needs it. The numbers worth your attention are:
available— an estimate of how much memory can be used before the system starts swapping;buff/cache— largely reclaimable, but not “wasted” while it’s there;Swap used— only meaningful together with current activity, because cold pages can sit in swap forever without causing any trouble.
While we’re here: don’t schedule echo 3 > /proc/sys/vm/drop_caches as an “optimization”. It throws away useful cache, corrupts your measurements, and usually makes the next file access slower. It’s a testing tool, nothing more.
Measure pressure, not gigabytes
Here’s the counterintuitive part that makes most quick diagnoses wrong: a machine at 90% memory usage can be perfectly healthy, and a machine with apparently plenty available can be stalling on reclaim. Usage tells you where the memory went; it doesn’t tell you whether anyone is waiting for it. That’s what Pressure Stall Information (PSI) is for:
cat /proc/pressure/memory
some avg10=0.21 avg60=0.08 avg300=0.03 total=1847331
full avg10=0.04 avg60=0.01 avg300=0.00 total=122840
some is the share of time when at least one task was stalled waiting on memory; full is when all non-idle tasks were stalled — the neighborhood of thrashing. There is no universal safe threshold here, and don’t let anyone sell you one: establish your own baseline and correlate increases with application latency and throughput.
Alongside PSI, keep an eye on actual paging:
vmstat 1
The columns that matter are si and so (swap-in and swap-out), r (runnable tasks), wa (I/O wait) and free memory. Swap that’s allocated but shows near-zero si/so is a completely different situation from continuous paging during every peak — the first is fine, the second is the problem you’re hunting.
Find out who’s actually eating the memory
Start with a simple ranking:
ps -eo pid,user,comm,rss,vsz,%mem --sort=-rss | head -n 20
One caveat before you trust those numbers: RSS counts shared pages once per process, so summing RSS across processes overcounts. If smem is available, it reports PSS, which splits shared pages fairly:
smem -tk
For a systemd service, ask systemd directly:
systemctl show name.service -p MemoryCurrent -p MemoryPeak -p MemorySwapCurrent
And to understand the global composition:
grep -E 'MemAvailable|AnonPages|Cached|SReclaimable|Slab|Swap' /proc/meminfo
The patterns to recognize: rising AnonPages usually points at application heaps; rising Slab or SReclaimable points at kernel caches; a large page cache on its own justifies exactly nothing.
The minimum baseline: 24 hours
Collect at least these measurements across one representative day:
| Measurement | Command | Question answered |
|---|---|---|
| Available memory | free -h | How much headroom remains? |
| Real pressure | cat /proc/pressure/memory | Are tasks stalling on reclaim? |
| Active paging | vmstat 1 | Is the host swapping now? |
| Largest processes | ps ... --sort=-rss | Who dominates RSS? |
| OOM events | journalctl -k -g 'oom|Out of memory' | Has the kernel killed anything? |
| Service peak | systemctl show ... | Is one service responsible? |
And write down the workload next to the numbers — requests per second, parallel jobs, active users, dataset size. A RAM figure without the load that produced it is not a baseline; it’s a screenshot.
What the baseline tells you
At the end of the 24 hours, the numbers point in one of a few directions, and each one maps to a different next step:
- Low PSI, no swap-in, stable available memory: don’t buy RAM just because
usedlooks high. There’s no problem here. - One process grows and never comes back down: hunt for leaks or unbounded caches before touching hardware.
- Short peaks of compressible cold pages: zram or zswap can absorb them — that’s part 2 .
- One service starves all the others: that’s a containment problem for cgroup limits — part 3.
- PSI and swap-in stay high after tuning, at steady useful load: now, and only now, physical expansion is backed by evidence.
At 2026 prices, that last bullet is the one you want to reach honestly — not by skipping the steps in between.